Fruit Fly Prediction
Introduction
From given dataset, we can build a model to predict fruit fly species based on its characteristics. There are several characteristics or features that we can leverage to predict which fruit fly species that it belongs to. In this project, we are going to compare two approach solving this problem which are using classic statistical model and complex neural network. The research paper can be found here
It is an important step to at least have a good understanding of your data before doing any modification towards the data so that we know that we are not removing or altering any important features. Based on the dataset and paper given, there are a lot of details about fruit flies wings which are described and summarized in table below. Width metrics seems like the same metric which is not the case since it is measuring from different point of view so we got three distinct wing width.
| Legend | Description |
|---|---|
| Species | Fruit fly species |
| Population | Fruit fly population |
| L2 | Second longitudinal vein length |
| L3p | Proximal length of third longitudinal vein |
| L3d | Distal length of third longitudinal vein |
| L3 | Third longitudinal vein length |
| W1 | Wing width |
| W2 | Wing width |
| W3 | Wing width |
| Vial | Which vial the experiment was held |
| Replicate | Replication index on the experiment |
| Wing Loading | Wing loading index |
There are other columns which are not quite as useful such as latitude ang longitude. These two columns are equivalent to population which makes them not as relevant as other columns.
Exploratory Data Analysis
After understanding a few key points in our data, the data can be visualized and analyzed to get a better picture of how the data is distributed and what are the things that we can do to improve the data.
Data Distribution
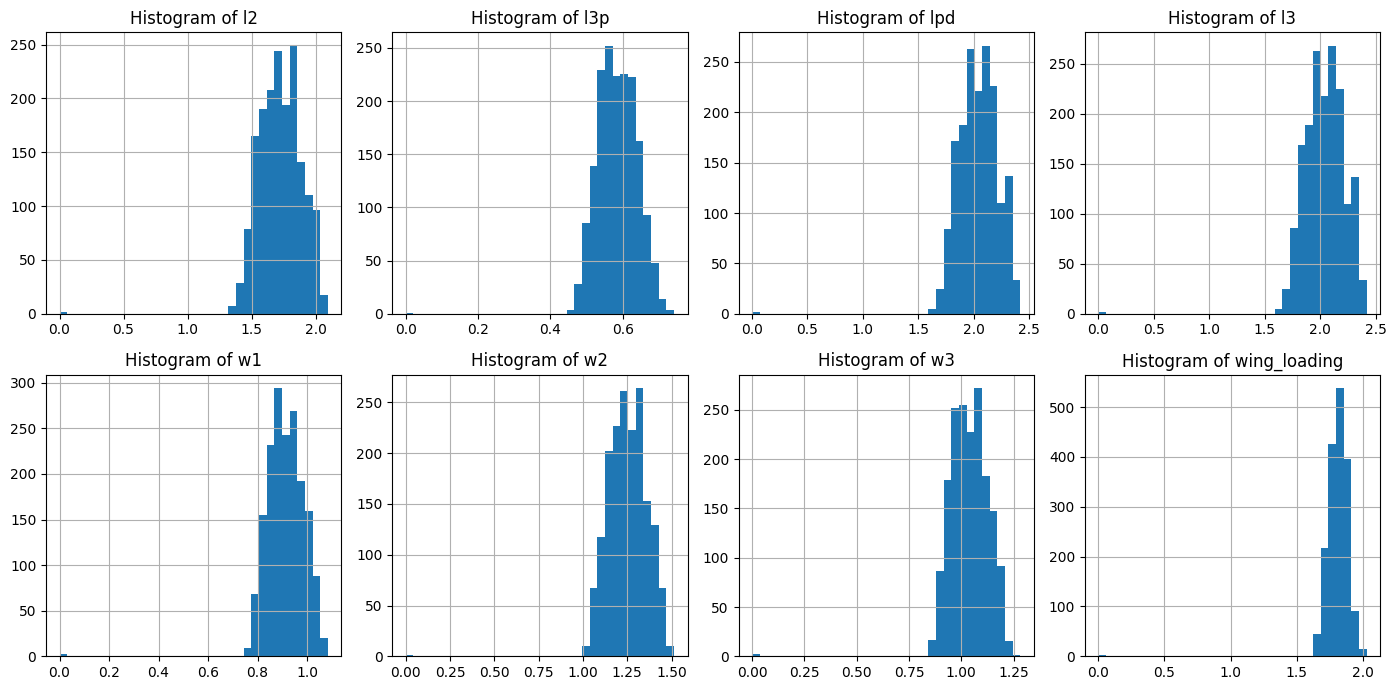
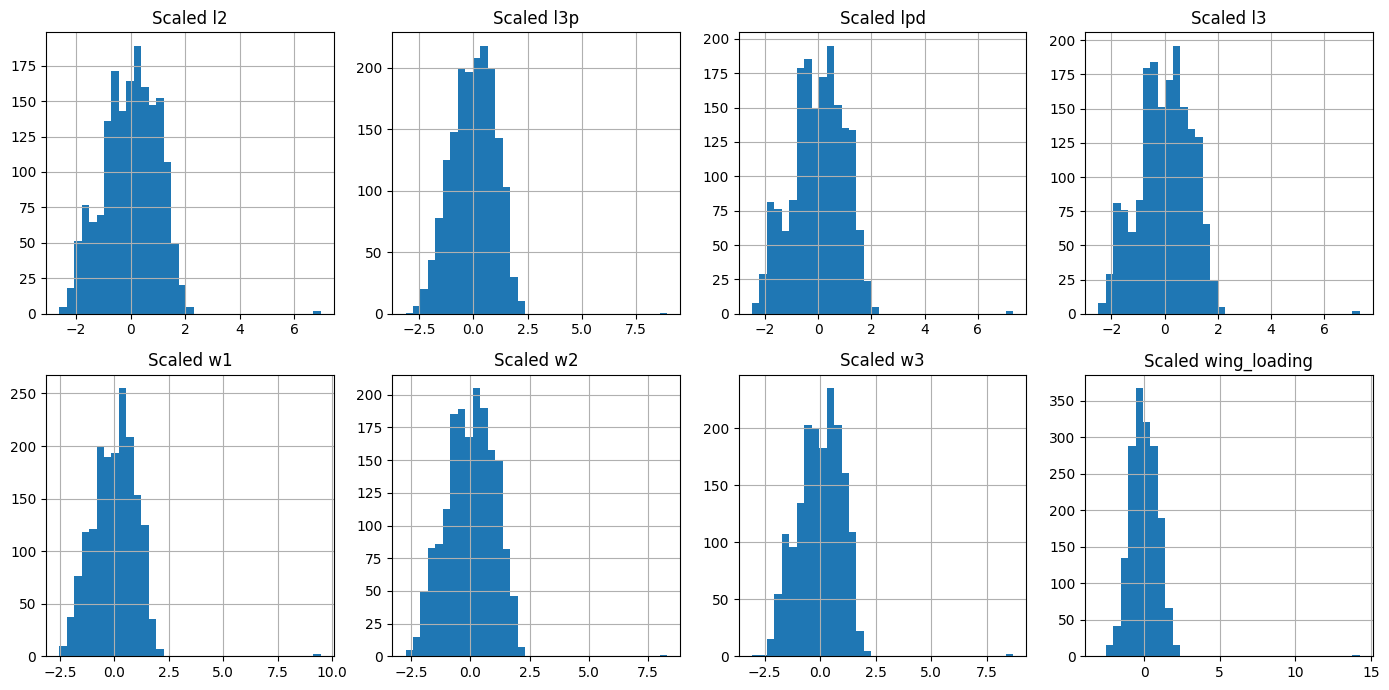
One of the best practices to do before applying any transformation is to see how the data ”looks like” so that we can apply an appropriate transformation, therefore, we can have a better performing model. We can easily illustrate this with an histogram to see how the data is distributed.
Vials and Repetitions
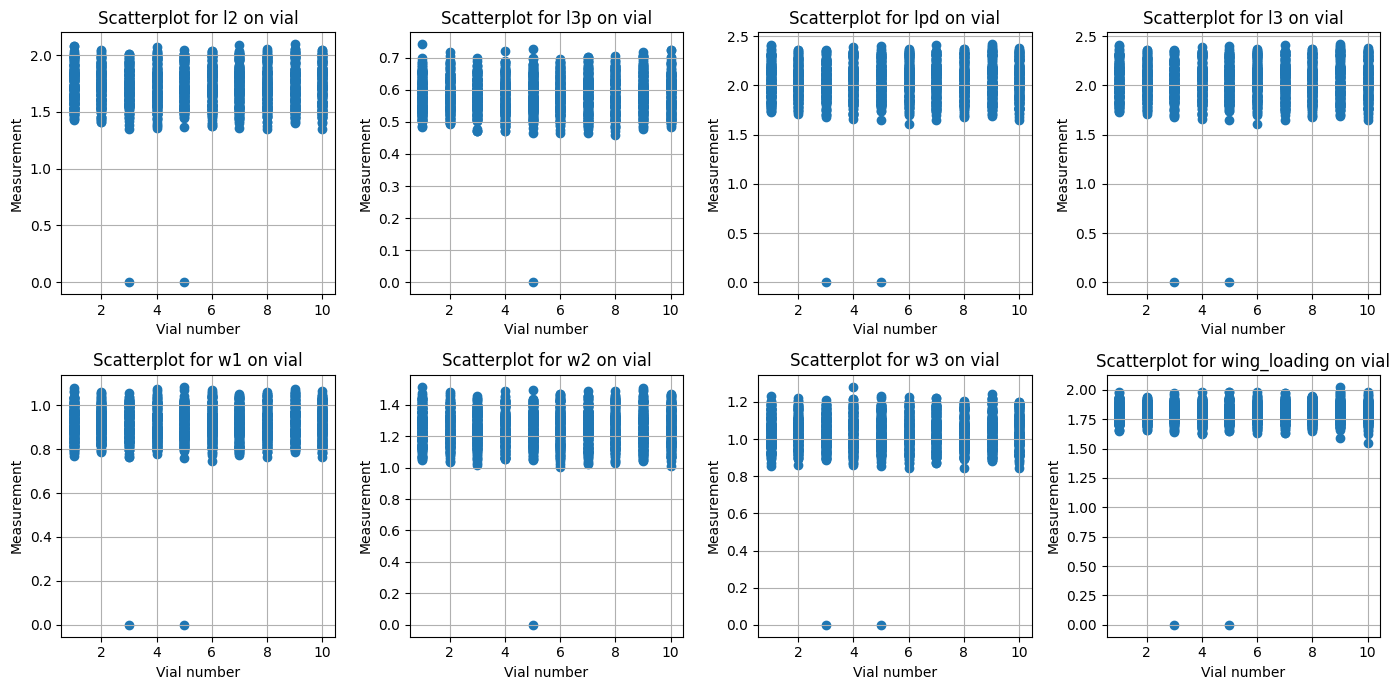
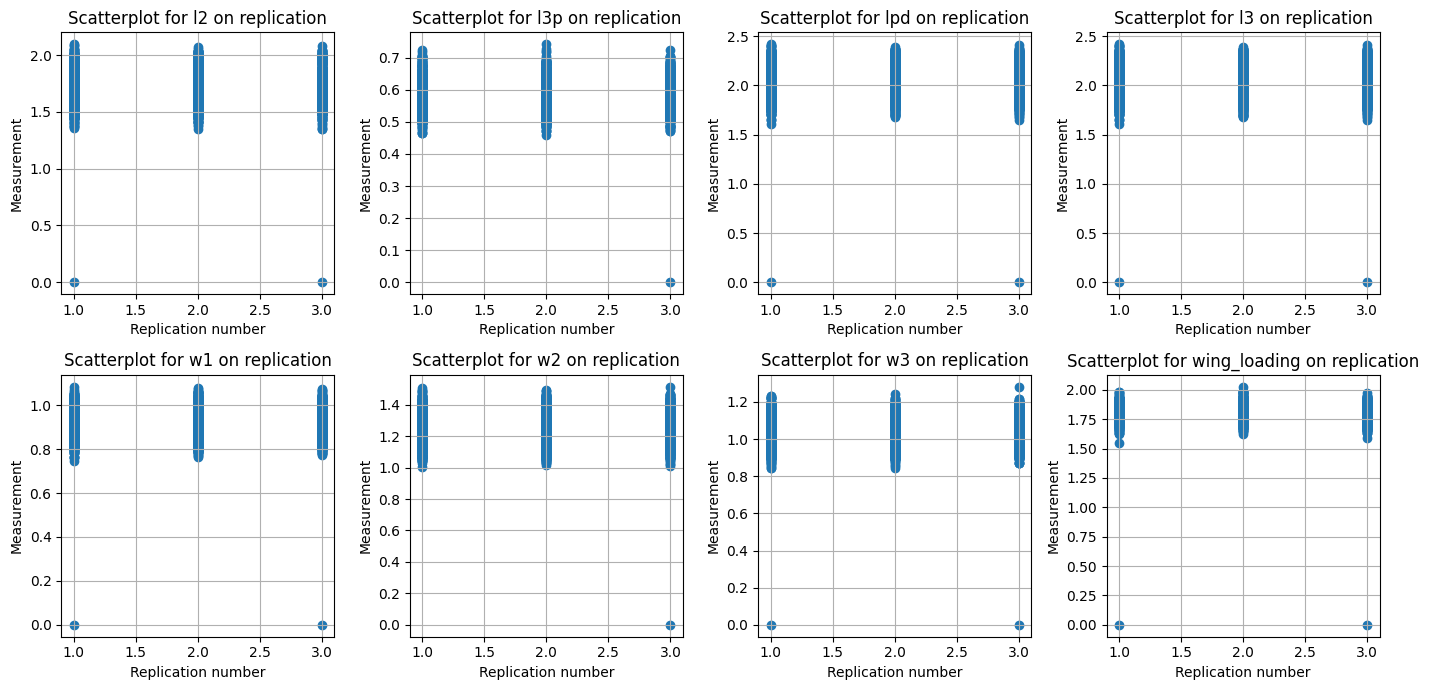
From observing the data, there are multiple vials and replications that has been used in this experimentation which might affect the result of the experiment. So in order to proof that all of our data is consistent, we can visualize how the data is distributed across vials and repetitions by plotting scatter plot as we can see from figure these two figures below. From these two plots, it shows that regardless of which vials and repetitions it comes from it has a consistent result.
Findings
From previous observation, we can see the consistency of data acrross vials and trials. Therefore, essen- tially, we can assume that the data is the same. Including it in our model might not be helpful or even harmful since there is no correlation at all with the independent variable.
Data Wrangling
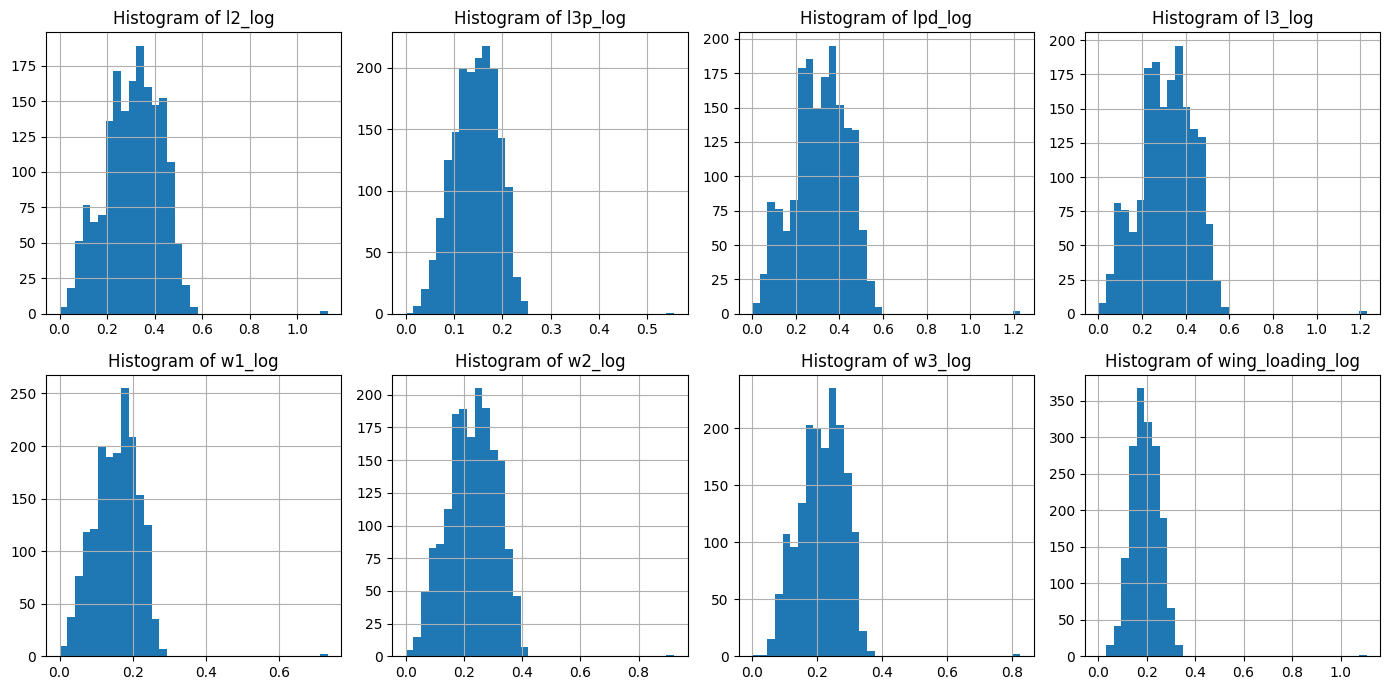
From previous graphs, we can see that the data is left-skewed. From this information, we can use either square transformation or log transformation. In this case, log transformation is chosen because it performs better to counter balance the data. After applying log transformation, the data is more centrally distributed. After applying the log transformation we can see the effect in these graphs below.
Principal Component Analysis
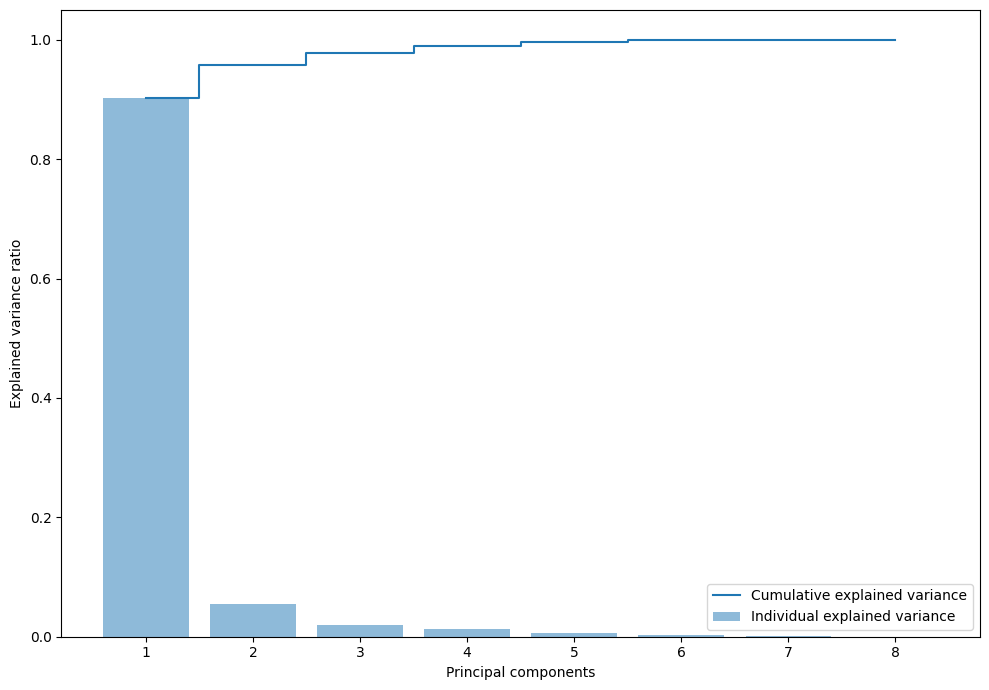
There are several features that is available to us from this dataset that we can use. But, these features are not necessarily useful or informative. A common way to know or estimate importance of feature is by applying principal component analysis(PCA). Before applying PCA, it is a good idea to normalize the dataset since PCA is known for its sensitivity towards unnormalized data.
After applying normalization, PCA is applied and we can see the result from this graph belwo. From the result, choosing more than 3 components have a little to none benefit. Therefore, only 3 components of PCA will be chosen onwards so that we can have the best performing model.
Model Fitting
Two models will be compared which are logistic regression and neural networks to predict the fruit fly species. Logistic regression was chosen due to its interpretability, while neural networks were chosen because of its prediction power. These models will be compared and evaluated to determine if sacrificing the interpretability of a statistical model is justified in favor of a complex model with higher predictive power. The dataset will also be compared with and without PCA. The main reason behind this is that PCA may alter the original nature of the dataset so it might remove its authentic feature.
Optuna
All hyper-parameters then will be optimized by Optuna library. Optuna library is a common library for searching the best hyperparameter. It uses algorithm to minimize or maximize the objective. This library provided a lot of choices of algorithm that we can choose from. From the research paper, it is proven that using a certain algorithm can help us find a optimal hyper-parameters. In that paper, they used sequential model-based optimization(SMBO) framework to optimize hyper-parameter. The implementation of this framework can be done with several algorithms such as gaussian process, and tree-structured parzen estimator.
The algorithm that is going to be used for this project is Tree-structured Parzen Estimator. This algorithm was chosen because of its flexibility, and it is meant to be general purpose with limited resources. 100 trials will be carried to find the best possible hyper-parameters and compare if PCA improves model performance. After that, 1000 trials will be done to find the best hyper-parameter for each model.
Logistic Regression
Logistic regression is a common statistical method to solve classification problem. It uses logistic function to transform combinations of input into probabilities. As it has been stated, this machine learning algorithm is chosen because of its simplicity, interpretability, and efficiency.
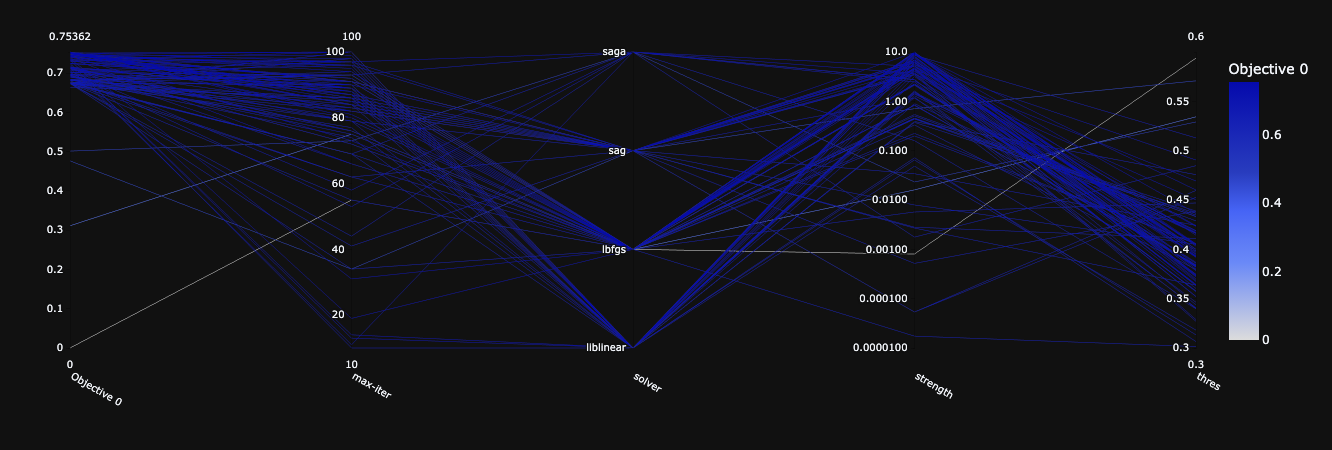
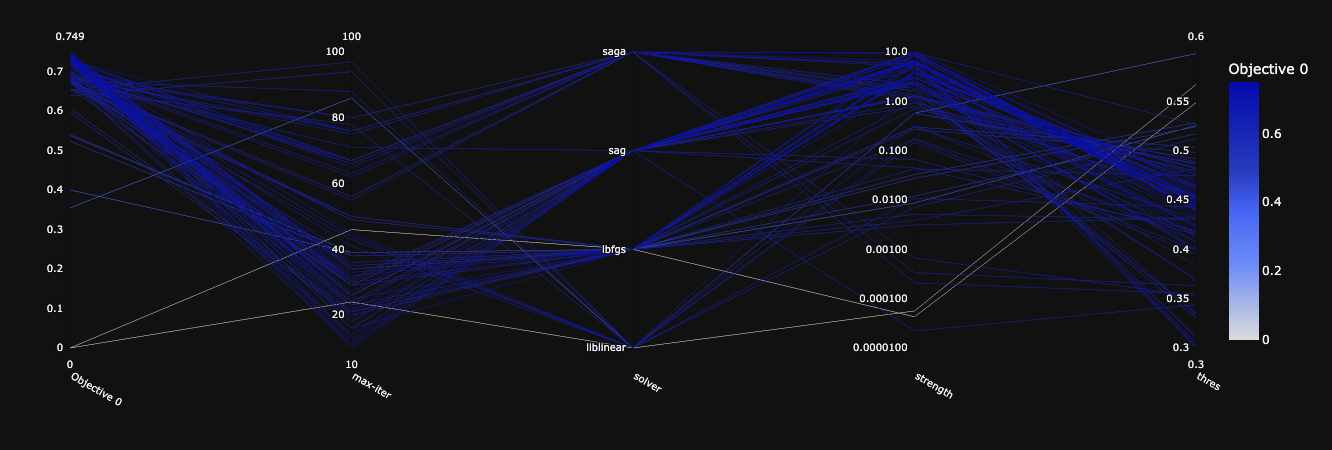
Here logistic regression is fitted into our training data. A line represent the trial itself, the x axis represent the hyper parameter, the y axis represent the hyper parameter value. The darker the line the higher objective value. The differences between the two is that figure the first figure does not use PCA, whereas the second figure use PCA. Both model performed relatively similar. The best trial from both score are 0.749 and 0.753 for with pca and without pca respectively.
Neural Networks
Neural network is a more advanced machine learning model which was inspired by the human brain. Neural networks consists of a bunch of neurons that is connected. It has been successful by capturing complex relationships in the data especially high dimentional data such as image and text. Since we are dealing with relatively simple data, simpler neural network architure will be constructed to solve this problem.
Pytorch framework were chosen due to its simplicity constructing a neural networks. Two layers with various number of hidden layers will be tested to solve this problem. A various number of batch size will also be tested to get the best performance out of the predefined neural networks.
Hyper Parameter Tuning
From those observation, we can conclude that in this partic- ular dataset, PCA is unnecessary. Since we know that PCA is not that helpful, from now on, model will be trained without applying PCA on our dataset.
We can also tweak further by providing more number of trials, wider range of values and giving more variables. For logistic regression, there are five hyper-parameters that will be tested against which are strength of the regularization, activation threshold, max iteration of the model, type of solver, and whether intercept is being used or not. For neural networks, there are five different hyper-parameters which are learning rate, activation function, optimizer, number of layers, and batch size.
Logistic Regression
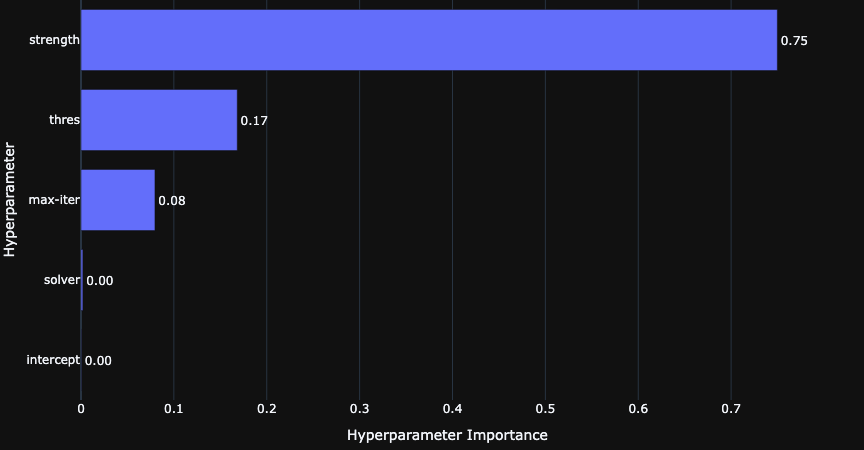
In this section, we are going to discuss further the trials, and result that has been done with Optuna. The best result that across 1000 trials is 0.7584. From graph below, we can see that the strength of regularization matters the most. The other three hyper-parameters that mat- ters are the activation threshold and maximum iteration of the model. Whereas, solver and intercept is not as significant as the other three. From that graph, we then can focus on these three variables since other parameters does not seem like it has any affect the result.
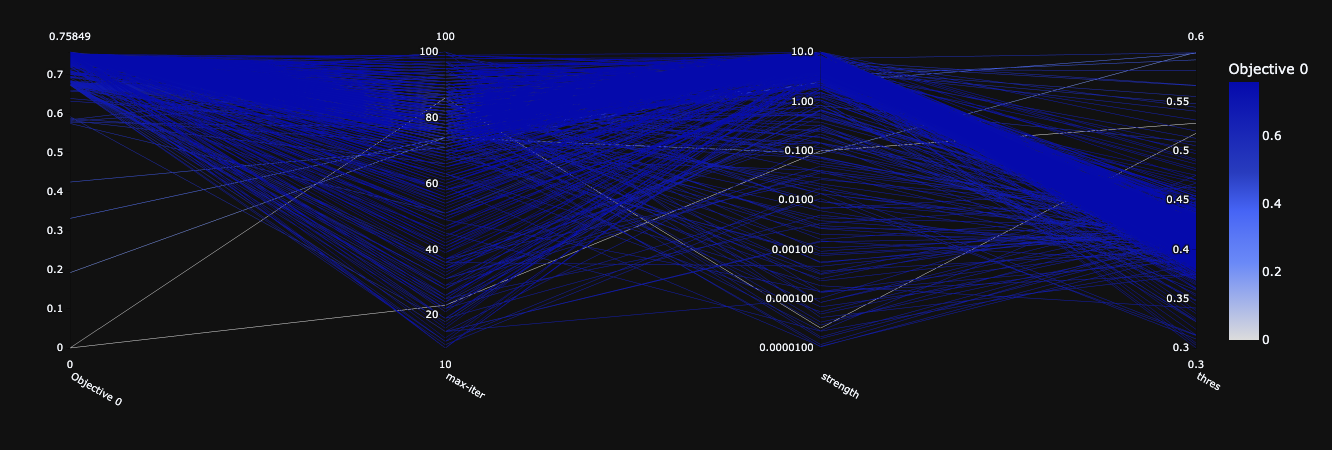
Furthermore, we can see that from graph below, the good result tends to have a bigger max iteration. A larger strength also seems like are more likely to get a more accurate result. Lastly within of 0.35 to 0.45 threshold has the best performance.
Neural Networks
For neural networks, the best model got 0.7621. Unlike logistic regression, neural networks has a lot more things that we can tinker about. Starting from number of hidden layers, batch size, activation function, optimizer, drop-out, max pool, convolution layers and so on. Because of the resource and time limitation, there are a few things that we are going to try to find the best hyper-parameter which can be found in this table
| Aspect | Test range |
|---|---|
| Number layers | 2-5 |
| Layer size | 64-256 |
| Batch size | 16-256 |
| Learning rate | $10^{-5} - 10^{-1}$ |
| Optimizers | adam, adamw, adamax, adadelta |
| Activation function | relu, tanh, sigmoid |
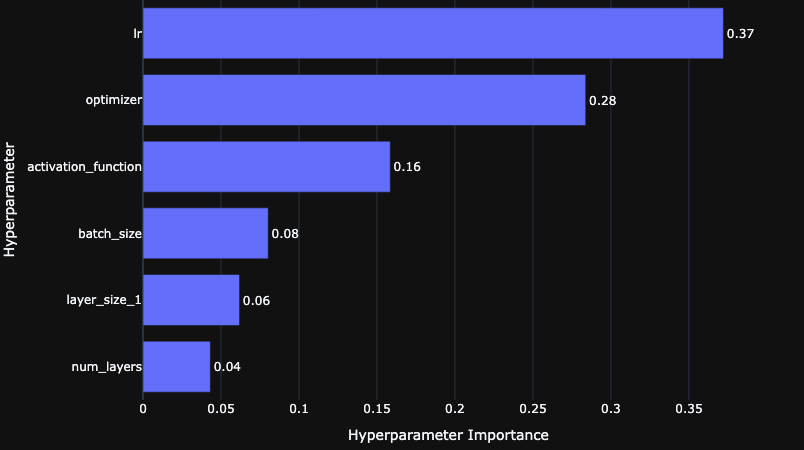
For neural networks, from figure below, it seems like a lot more hyper-parameters are quite important for model performance being learning rate is the most important. Followed by optimizer and activation function.
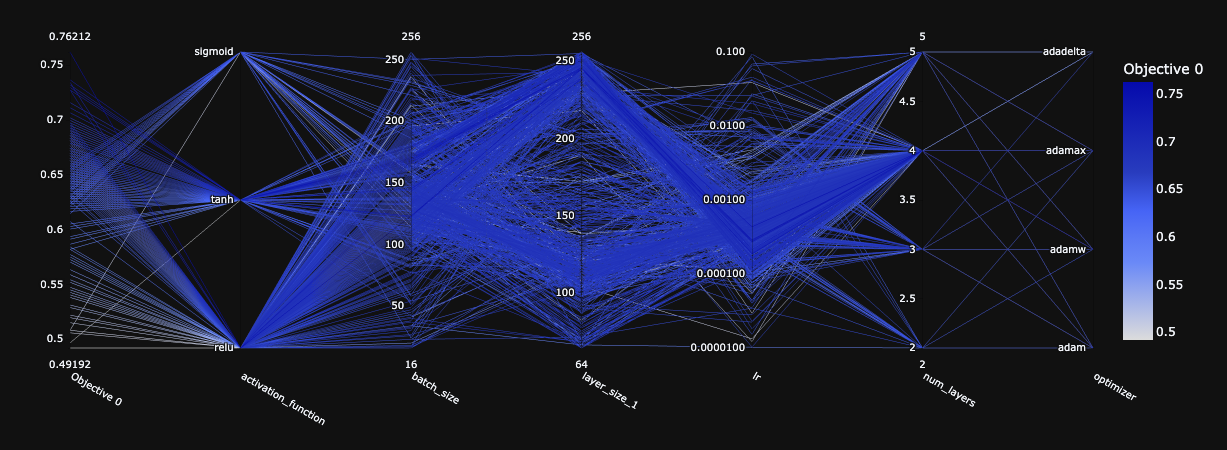
We an analyze further from graph above, which highlights the importance of selecting neural networks hyper-parameters. Specifically, the relu activation function, relatively small learn- ing rate, higher number of layers, the more likely the model will perform better.
Concolusion
From both experiment that we have explored, for this particular dataset, PCA is unnecessary. Potential explanation for this is that the feature is not complext enough to apply PCA’s effectiveness.
Both machine learning method got similar result despite of how different they are in terms of how they work. Even though logistic regression is far more simpler rather than neural networks, it performed marginally worse than neural networks.
In this use case, I do not think that it is justified to use nerual networks instead of logistic regression. First, because it generally has better performance rather than neural networks. Secondly the training process and fine tuning is far faster. Lastly, it interpratibility is far more transparent rather than networks.